


Strait of Hormuz Crisis: How a Shipping Bottleneck Could Hit Oil Prices, Trade Routes, and Global Inflation
Last updated: May 13, 2026
Quick Answer: Since late February 2026, shipping through the Strait of Hormuz has been largely blocked following the launch of Operation Epic Fury and Iran’s retaliatory closure of the waterway. Because roughly 20% of the world’s traded oil passes through this 33-kilometre-wide chokepoint, the disruption is already pushing energy prices higher, rerouting global supply chains, and threatening a new wave of inflation in import-dependent economies.
Key Takeaways
- The Strait of Hormuz has been effectively closed to commercial shipping since February 28, 2026, creating what analysts are calling a “dual blockade” involving both Iranian and US-led military operations [3]
- Iran’s Revolutionary Guard (IRGC) has attacked and boarded merchant vessels and laid sea mines, making transit insurance nearly impossible to obtain [1]
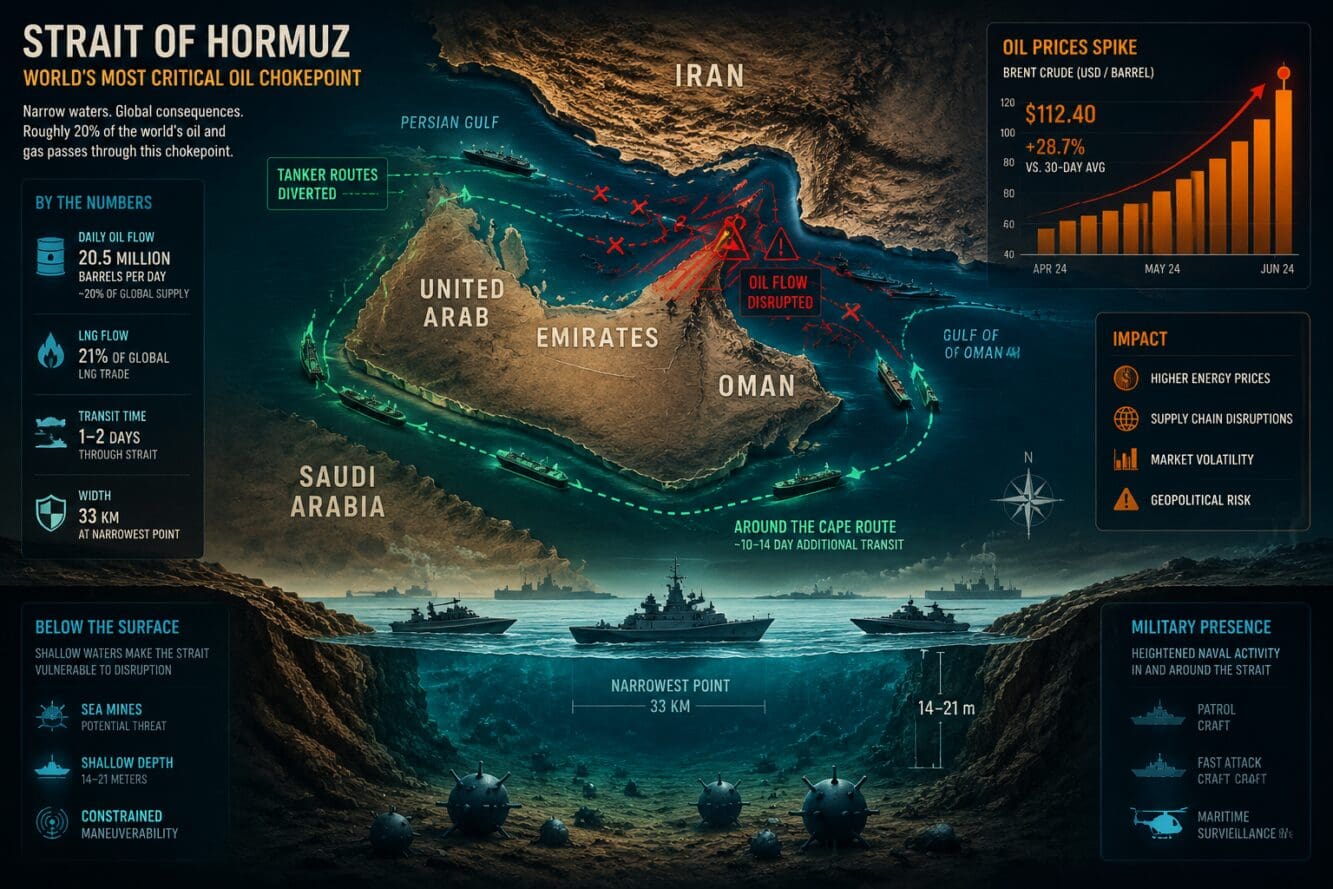
- An estimated 20–21 million barrels of oil per day normally flow through the strait (roughly one-fifth of global supply)
- Countries most exposed include Japan, South Korea, India, and several European nations that rely heavily on Gulf crude
- Alternative routes — around the Cape of Good Hope or through the Suez Canal — add weeks and significant cost to voyages
- Oil price spikes from prolonged closures historically feed through to consumer prices within 6–12 weeks
- Industries most at risk include petrochemicals, aviation, shipping, and automotive manufacturing
- A ceasefire or negotiated reopening remains the single biggest variable for energy markets in 2026 [9]
Why the Strait of Hormuz Is the World’s Most Critical Oil Chokepoint
The Strait of Hormuz is irreplaceable in the short term. No pipeline network or alternative sea route can absorb the volume of crude oil and liquefied natural gas (LNG) that normally flows through it each day.
The strait connects the Persian Gulf to the Gulf of Oman, and from there to global markets. At its narrowest point, ships travel through lanes just a few kilometres wide. The countries that export through it — Saudi Arabia, the UAE, Kuwait, Iraq, and Iran itself — collectively hold a large share of the world’s proven oil reserves.
Key flow figures (pre-crisis estimates):
| Commodity | Daily Volume Through Strait |
|---|---|
| Crude oil & condensate | ~17–18 million barrels/day |
| LNG | ~4 trillion BTU/day (est.) |
| Refined petroleum products | ~3 million barrels/day |
Sources: US Energy Information Administration historical data; figures are pre-2026 crisis estimates.
What Triggered the 2026 Strait of Hormuz Crisis
The immediate trigger was Operation Epic Fury, launched by the US and Israel on February 28, 2026, which resulted in the death of Iranian Supreme Leader Ali Khamenei. Iran responded with missile strikes against US bases and Gulf allies, and the IRGC moved quickly to weaponize the strait — warning commercial vessels to stay out, boarding ships, and deploying sea mines [1][3].
The result is what crisis analysts are now describing as a dual blockade: Iran controls the northern and eastern approaches, while US and allied naval forces are operating in the Gulf itself [2]. For commercial shipping operators, neither side offers a safe passage guarantee.
“The economic consequences of a prolonged Hormuz closure extend far beyond the energy sector — they reach into every supply chain that depends on affordable fuel.” — Crisis Group, May 2026 [6]
This is not a theoretical risk scenario anymore. It is an active disruption with real costs accumulating daily.
How a Shipping Bottleneck Could Hit Oil Prices, Trade Routes, and Global Inflation
The direct price effect is already visible. When a chokepoint of this scale closes, oil markets reprice immediately — traders do not wait for physical shortages to materialize.
Three transmission channels drive inflation:
Energy costs rise first. Crude oil price spikes raise the cost of fuel for transport, heating, and electricity generation. Yahoo Finance analysis suggests that a prolonged closure could ultimately suppress demand as prices become unaffordable — a dynamic known as demand destruction [10].
Shipping costs follow. War-risk insurance premiums for tankers operating near the strait have surged. Vessels rerouting around Africa’s Cape of Good Hope add roughly 10–15 extra sailing days per round trip, increasing freight rates across all cargo categories — not just oil.
Consumer prices lag by weeks. Fuel cost increases flow through to food production, manufacturing, and retail logistics. Economies that import most of their energy — Japan, South Korea, Pakistan, and several EU members — face the sharpest consumer price pressure.
Countries most exposed to the Strait of Hormuz Crisis:
- 🇯🇵 Japan — imports nearly 90% of its oil from the Gulf region
- 🇰🇷 South Korea — similarly Gulf-dependent for crude
- 🇮🇳 India — a major Gulf crude buyer with limited short-term alternatives
- 🇩🇪 Germany / EU — exposed through LNG and refined product markets
- 🇨🇳 China — the world’s largest oil importer; significant Gulf exposure [related: Beijing coverage]
Which Industries Face the Biggest Disruption
Beyond energy companies, several industries face direct operational risk from the Strait of Hormuz Crisis.
Most exposed sectors:
- Aviation: Jet fuel prices track crude closely; airlines operating thin margins face immediate cost pressure
- Petrochemicals: Feedstock shortages affect plastics, fertilizers, and pharmaceuticals
- Automotive manufacturing: Just-in-time supply chains are vulnerable to fuel cost spikes and parts delays
- Cargo shipping: All vessel operators face higher insurance and rerouting costs, not just tankers
The cargo and trade disruption extends beyond oil. Container ships, bulk carriers, and LNG tankers all use the same lanes. When those lanes close, every product they carry becomes more expensive to move.
For businesses tracking global trade developments in 2026, the strait crisis represents one of the most significant supply-side shocks since the COVID-era port backlogs.
What Are the Alternative Routes — and Do They Work?
Alternative routes exist, but none are cost-free or fast.
Main detour options:
table>Saudi Arabia’s East-West Pipeline can bypass the strait for some crude, but it cannot handle LNG or the full volume of Gulf exports. The Cape route is viable but expensive — and it strains global tanker capacity when every operator tries to use it simultaneously.
The black gold trade simply has no perfect detour. That is what makes this crisis structurally different from a typical geopolitical oil shock.
FAQ
Q: How much oil flows through the Strait of Hormuz? Roughly 20–21 million barrels per day of crude oil, condensate, and refined products — approximately one-fifth of global oil trade — passed through the strait before the 2026 crisis began.
Q: Has the strait ever been fully closed before? No full closure has occurred in modern history, though Iran threatened closure repeatedly during the 1980s Tanker War and again during 2011–2012 nuclear negotiations. The 2026 situation is the most severe disruption on record [3].
Q: How quickly do oil price spikes reach consumers? Typically within 4–8 weeks for fuel prices at the pump, and within 6–12 weeks for broader consumer goods inflation, as transport and production costs work through supply chains.
Q: Which country is most vulnerable to a prolonged closure? Japan is arguably most exposed, importing close to 90% of its oil from Gulf producers with very limited domestic production or alternative supply contracts.
Q: What is “war-risk insurance” and why does it matter? War-risk insurance covers ships operating in conflict zones. When premiums spike — as they have in 2026 — shipping companies either pass costs to customers or avoid the route entirely, both of which raise consumer prices.
Q: Could strategic petroleum reserves (SPRs) offset the disruption? SPRs in the US, IEA member states, and China can buffer short-term shortfalls — typically 90 days of import cover for IEA members — but they are not designed for indefinite closures.
Q: Is a ceasefire likely to reopen the strait quickly? Vatican News reporting from May 2026 notes that even a ceasefire may not immediately restore commercial confidence, as sea mine clearance and insurance market normalization take additional weeks [9].
Q: How does this affect Canada? Canada is a net oil exporter and less directly exposed to Gulf crude, but higher global oil prices affect Canadian fuel costs, and disrupted global supply chains raise the cost of imported goods. Canada’s energy trade dynamics are worth monitoring as the crisis evolves.
Conclusion: What to Watch — and What to Do Now
The Strait of Hormuz Crisis represents a real-time stress test for global energy markets, supply chains, and inflation management. The core risk is not just a short-term price spike — it is the possibility that a weeks-long disruption becomes a months-long structural shift in how oil reaches markets.
Actionable steps for different stakeholders:
- Businesses with fuel-sensitive operations: Lock in forward contracts or hedging instruments now, before further price escalation
- Investors: Monitor IEA emergency stock release announcements and tanker rate indices (Baltic Dirty Tanker Index) as leading indicators
- Policymakers: Accelerate diversification of energy import sources and review strategic reserve drawdown thresholds
- Consumers: Expect elevated fuel and food prices through at least Q3 2026 if the blockade continues; budget accordingly
The single biggest variable remains a negotiated ceasefire or diplomatic resolution [6][9]. Until that happens, every week of closure adds cost, complexity, and inflationary pressure to an already strained global economy. Tracking developments through credible sources — including business and economic analysis — is essential for anyone making financial or operational decisions in 2026.
References
[1] Strait Of Hormuz Crisis 2026 – https://kureansiklopedi.com/en/detay/strait-of-hormuz-crisis-2026-16e7b
[2] Strait Of Hormuz Closure 2026 – https://carraglobe.com/strait-of-hormuz-closure-2026/
[3] 2026 Strait Of Hormuz Crisis – https://en.wikipedia.org/wiki/2026_Strait_of_Hormuz_crisis
[6] Hormuz 5 May 2026 – https://www.crisisgroup.org/content/hormuz-5-may-2026-1
[9] Hormuz Iran US War Ceasefire Economic Crisis – https://www.vaticannews.va/en/world/news/2026-05/hormuz-iran-us-war-ceasefire-economic-crisis.html
[10] How Prolonged Strait Of Hormuz Closure Could Lead To Oil Demand Destruction – https://finance.yahoo.com/video/how-prolonged-strait-of-hormuz-closure-could-lead-to-oil-demand-destruction-151454485.html
Content, illustrations, and third-party video appearing on GEORGIANBAYNEWS.COM may be generated or curated with AI assistance or reproduced pursuant to the fair dealing provisions of the Copyright Act, R.S.C. 1985, c. C-42. Attribution and hyperlinks to original sources are provided in acknowledgment of applicable intellectual property rights. Such referencing is intended to direct traffic to and support the original rights holders’ platforms.


